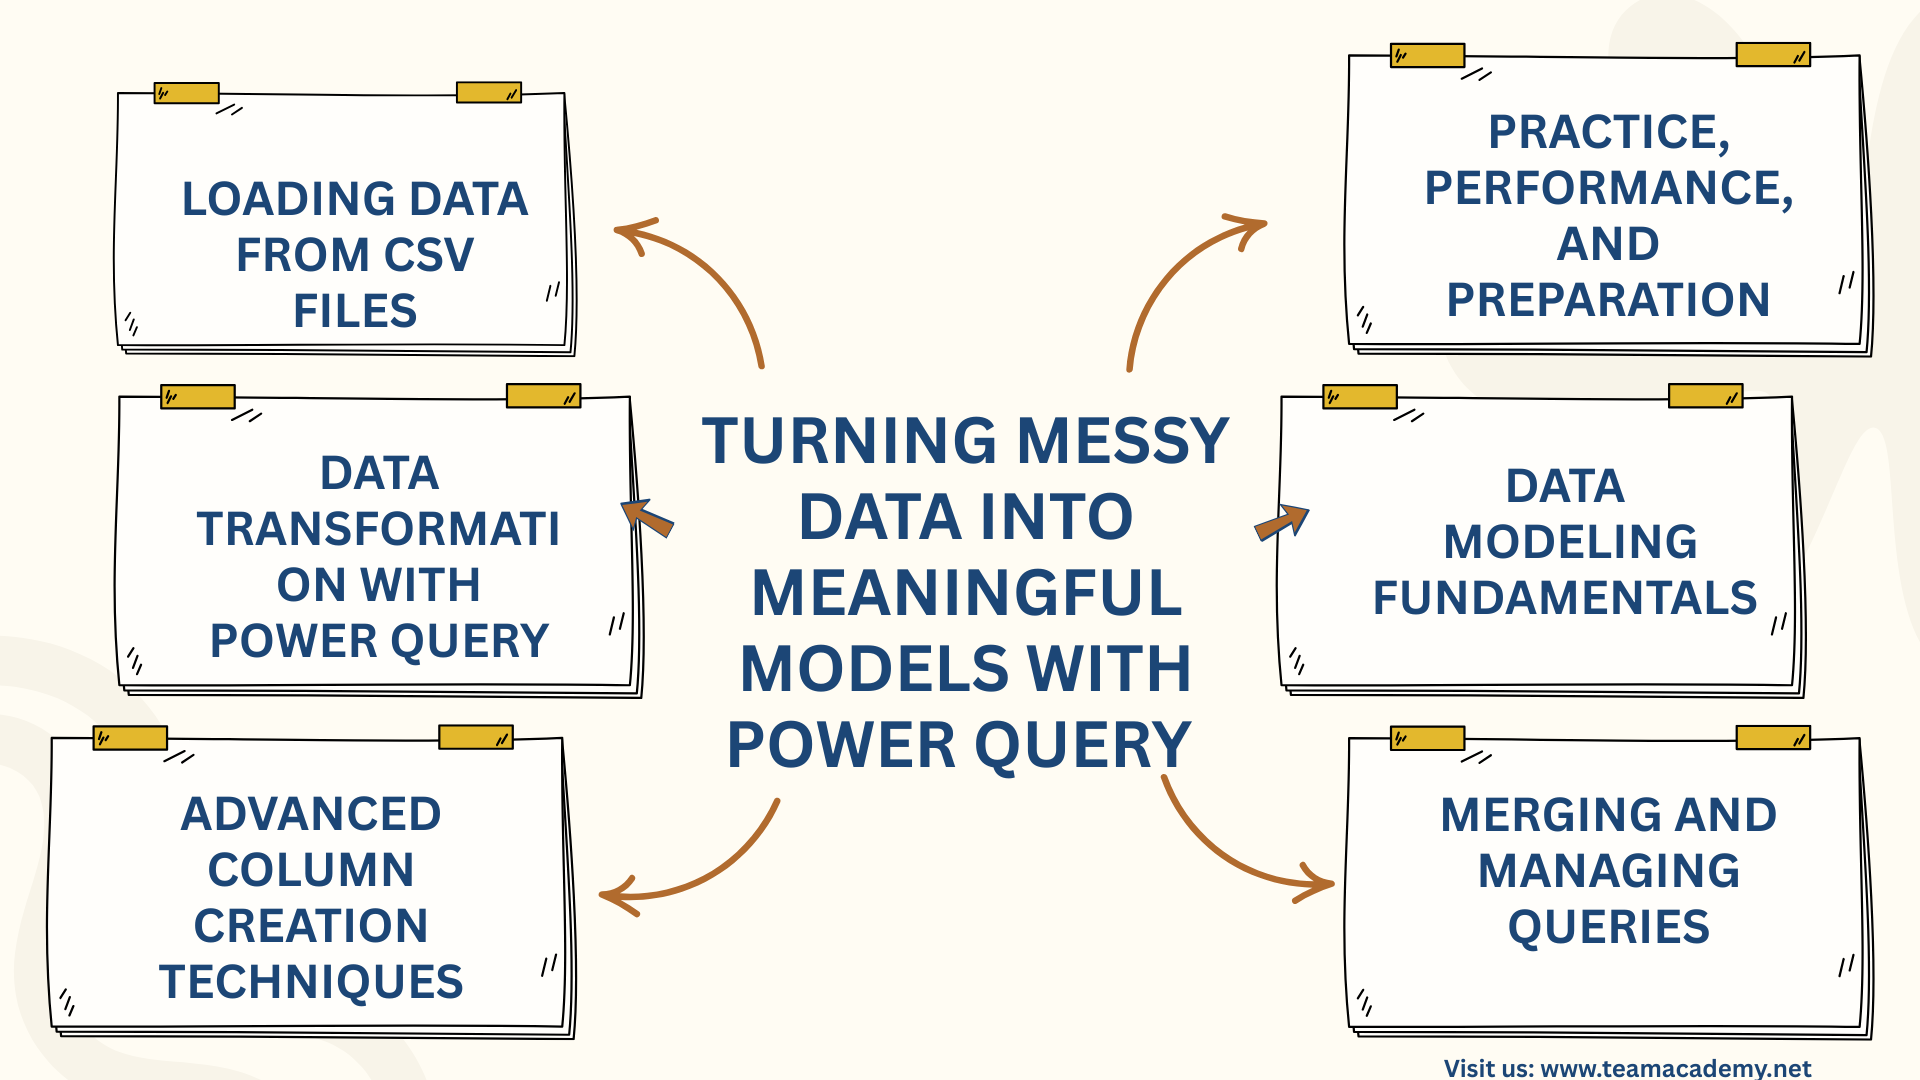
📊 Turning Messy Data into Meaningful Models with Power Query 📊
🚀 Introduction
This session focused on building strong foundations in Power Query and Power BI, guiding participants through real-world data analysis techniques using the Northwind Traders e-commerce case study. The goal was to move beyond Excel-based lookups and manual calculations and instead adopt scalable, performance-driven data modeling and transformation practices.
📂 Loading Data from CSV Files
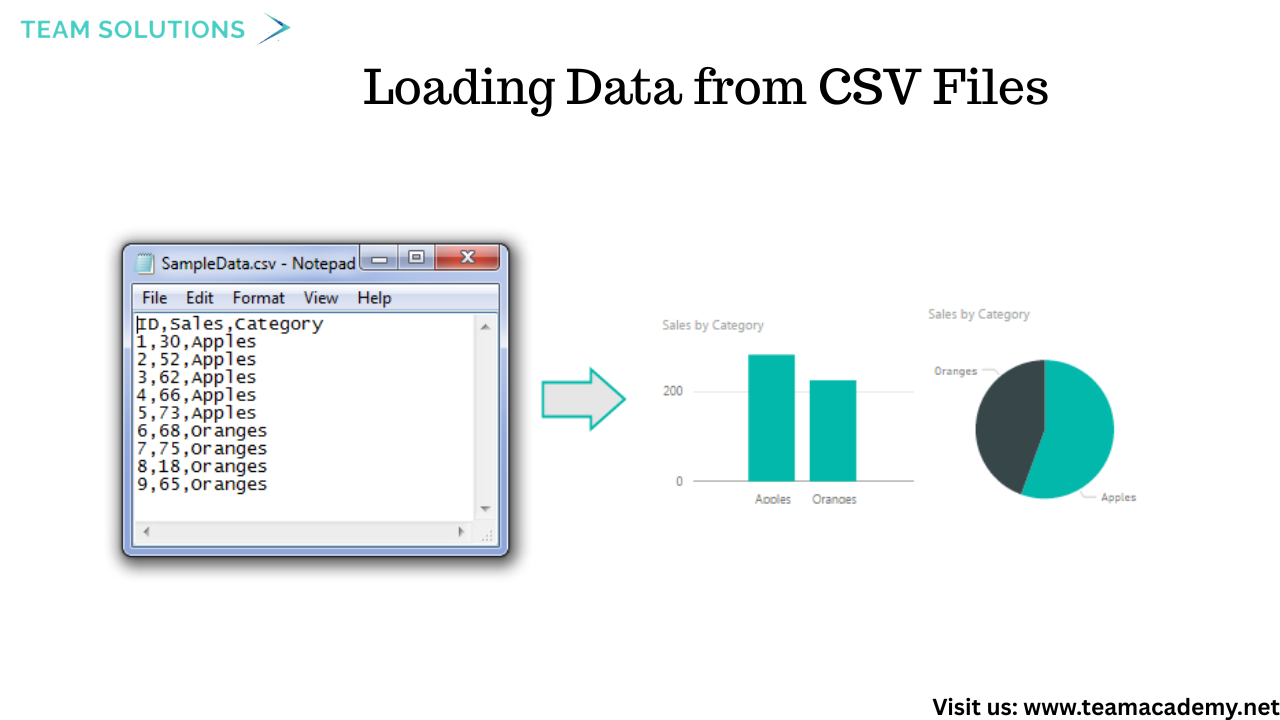
Participants learned how to load data from multiple CSV files, a common format used by IT teams for sharing large datasets. Using a folder-based approach, several files—such as orders, products, customers, employees, and shippers—were imported into Power BI in one go.
💡 Key takeaway: Regardless of whether the data source is Excel, CSV, SQL Server, or SharePoint, Power Query transformation logic remains the same.
🔧 Data Transformation with Power Query
The session covered essential Power Query techniques used in everyday business reporting:
✂️ Splitting text columns using delimiters
🧮 Creating calculated columns (e.g., total sales, discounts)
📅 Handling date, time, and duration fields
🚫 Managing null values and replacing errors
🔁 Promoting headers and correcting data types
Participants also learned how to undo transformations by removing applied steps—encouraging experimentation without fear of breaking data.
🧠 Advanced Column Creation Techniques
Several powerful features were introduced to simplify data preparation:
🧪 Columns from Example to auto-generate transformations
🧩 Conditional columns for business logic (e.g., shipping delay categories)
🔢 Mathematical operations for sales and performance metrics
These tools showed how Power Query can handle most Excel use cases—without complex formulas.
🧩 Merging and Managing Queries
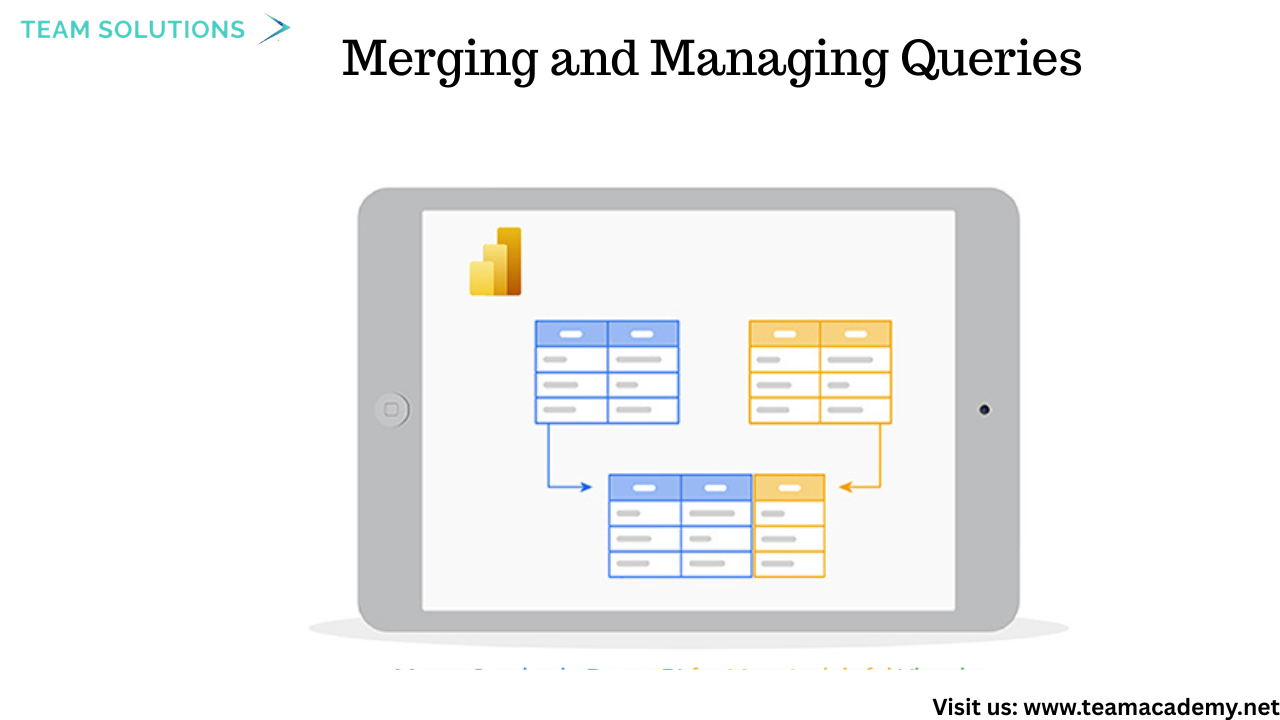
Instead of relying on Excel VLOOKUPs, participants learned how to merge queries in Power Query to combine related tables such as products and categories. This approach improves performance and creates cleaner data models.
The difference between duplicating queries and referencing queries was also explained, helping participants manage transformations efficiently.
🏗️ Data Modeling Fundamentals
The session introduced core data modeling concepts critical for reporting and certification exams:
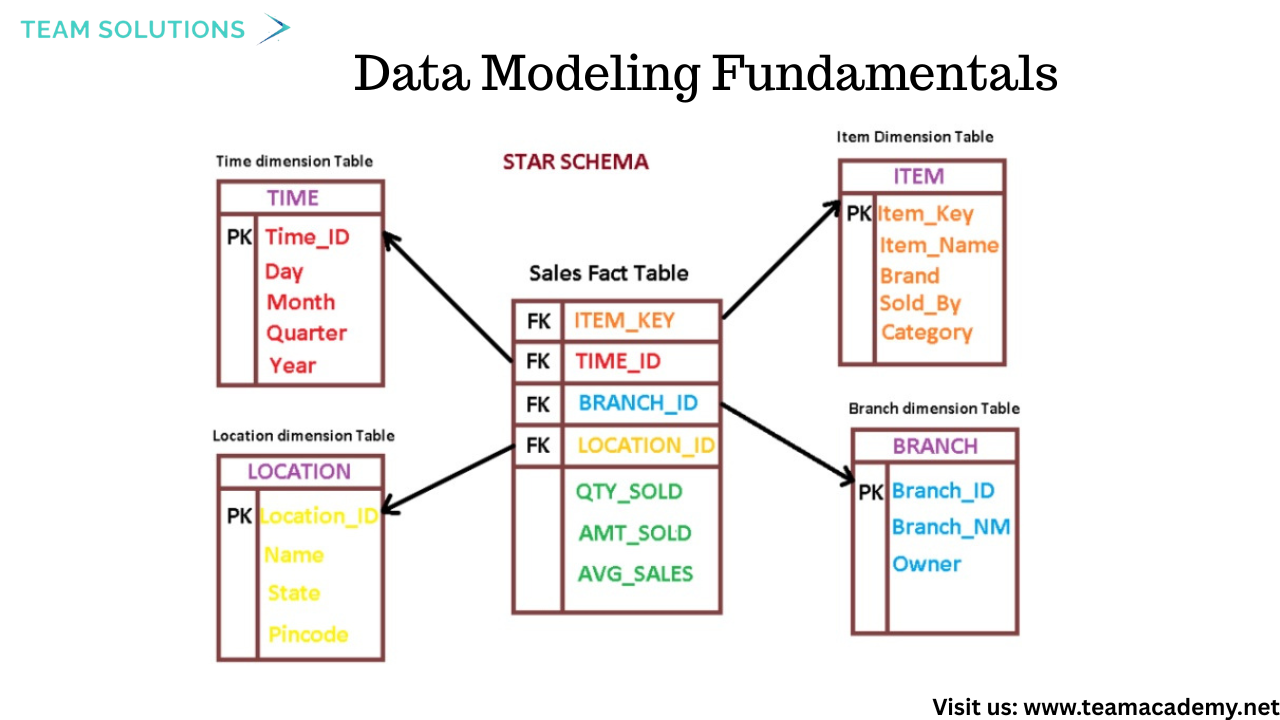
📌 Fact tables vs Dimension tables
⭐ Star schema vs ❄️ Snowflake schema
🔗 Understanding table relationships for flexible analysis
These concepts were explained using real e-commerce examples, reinforcing how proper modeling supports faster, more accurate insights.
📈 Working with Dates, Durations, and Measures
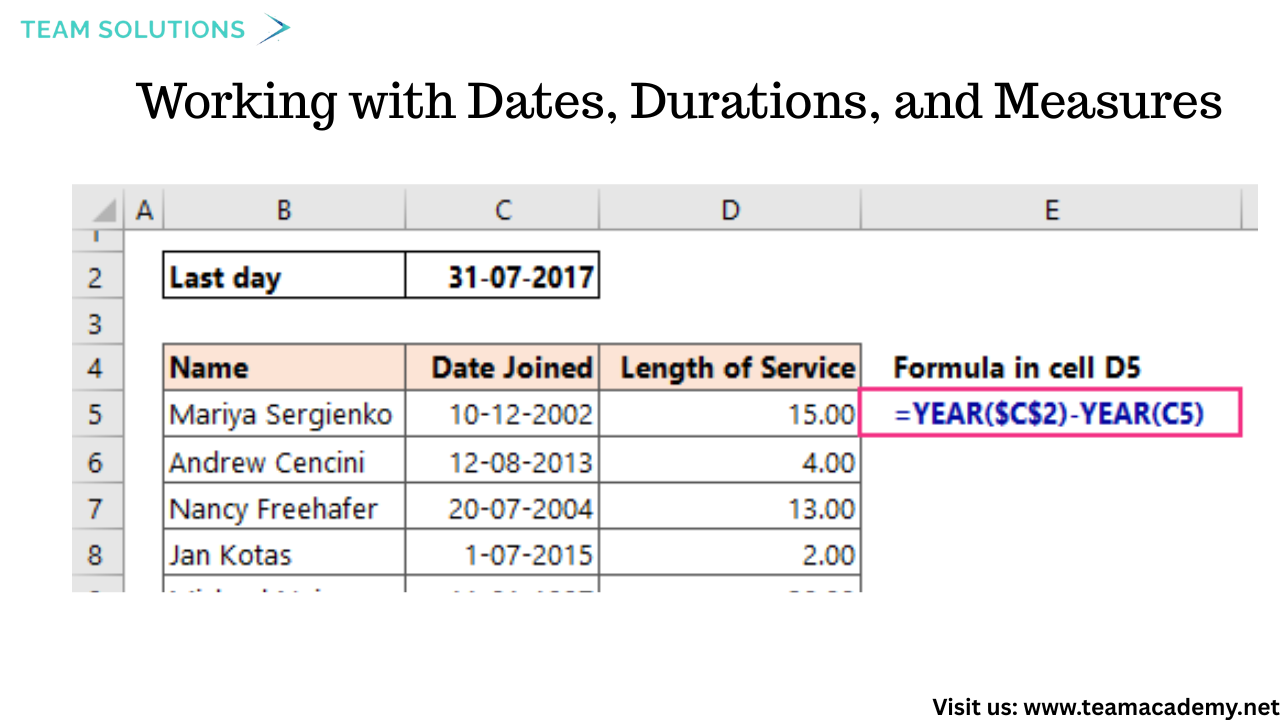
Participants practiced transforming date-related fields, including:
Calculating age from date of birth
Measuring durations between timestamps
Extracting year and month values
They also learned best practices such as minimizing applied steps to improve report performance and user experience.
🎯 Practice, Performance, and Preparation
The session emphasized the importance of hands-on practice. Participants were encouraged to:
Experiment with transformations independently
Bring real business datasets to future sessions
Prepare for upcoming topics such as appending queries, advanced modeling, and exam-focused scenarios
This case study approach closely mirrors real-world business intelligence challenges and aligns well with PL-300 certification preparation.
🔑 Key Takeaways
✅ Power Query simplifies complex data preparation
✅ CSV files are common and powerful data sources
✅ Proper modeling improves performance and scalability
✅ Star schemas are preferred for reporting
✅ Practice is essential for mastery
📌 What’s Next?
The upcoming sessions will dive deeper into appending queries, advanced data modeling, and real-life dashboard scenarios—helping participants turn clean data into meaningful insights
Need assistance with power query file source change
My question is if I have 5 to 6 files and I need to change their sources in one go instead of changing each file's source separately and all the files are in the same source of folder. How to do it?