📊 Power BI Fundamentals: Data Extraction, Transformation & Visualization 🚀
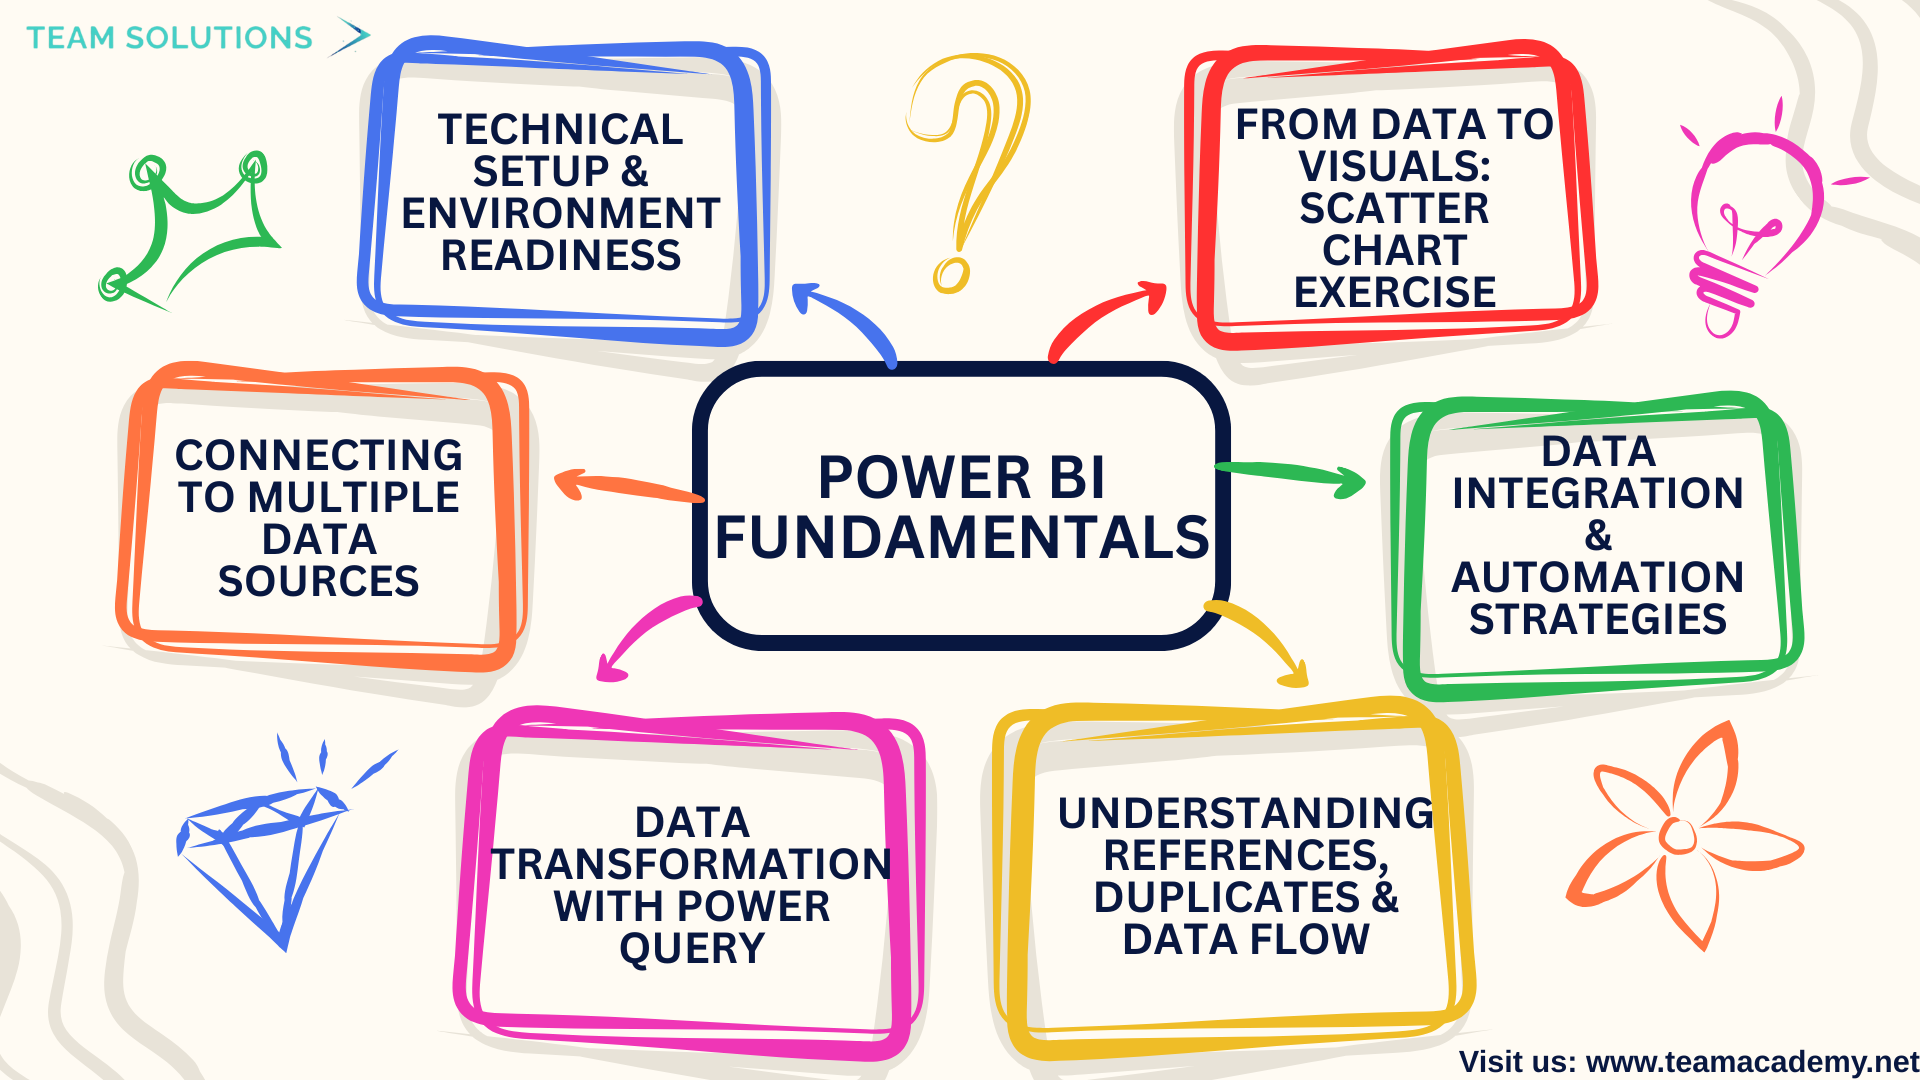
This session introduced learners to the core fundamentals of Power BI, with a strong emphasis on data extraction, transformation, and basic visualization techniques. The focus was on building a solid foundation for working with real-world datasets using Power Query, enabling participants to confidently move from raw data to meaningful insights.
🔧 Technical Setup & Environment Readiness
The session began with a technical setup walkthrough, ensuring all participants had:
✅ The correct version of Power BI Desktop installed
📁 Access to the practice datasets
📦 Proper extraction of downloaded files
A key concept highlighted early was Power BI’s philosophy of working with tables and structured data, rather than individual Excel cells—an essential mindset shift for effective BI development.
🔌 Connecting to Multiple Data Sources
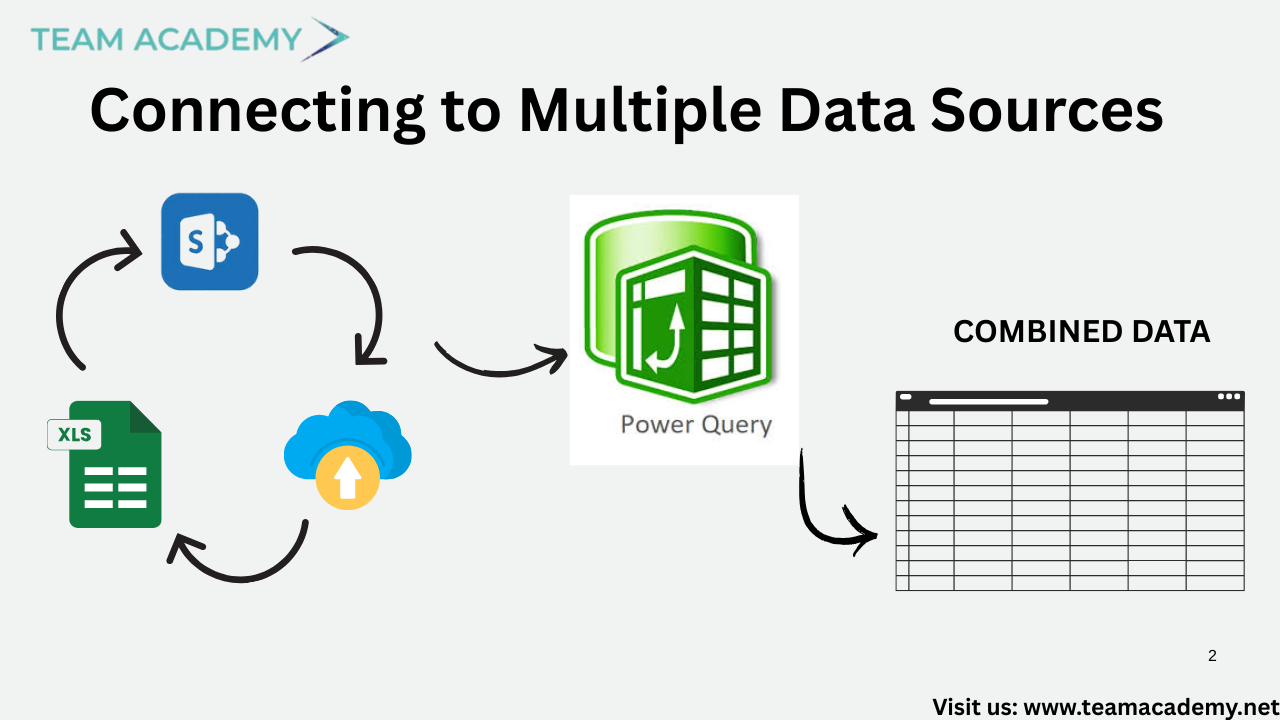
Participants explored how Power BI connects to a wide range of data sources, including:
📊 Excel workbooks and folders
🗂️ Shared OneDrive directories
🗄️ Databases and cloud platforms
The importance of choosing the right data source (tables vs sheets) was emphasized to avoid data inconsistencies and transformation errors.
🔄 Data Transformation with Power Query
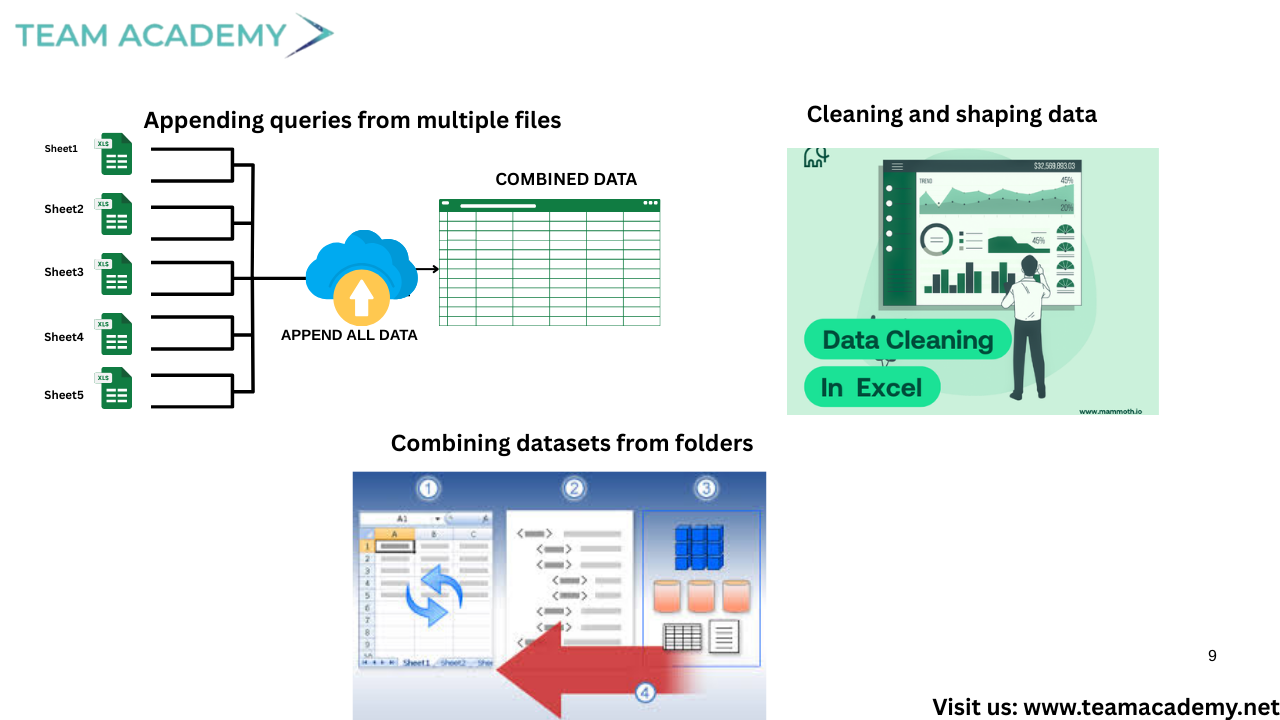
A major part of the session focused on Power Query, the engine behind data preparation in Power BI. Learners practiced:
🧹 Cleaning and shaping data
➕ Appending queries from multiple files
🔗 Combining datasets from folders
🧠 Managing data types and metadata
⚠️ Identifying and handling errors
The difference between duplicating queries and referencing queries was clearly explained, helping participants understand performance optimization and dependency management.
🧩 Understanding References, Duplicates & Data Flow
Participants learned:
📌 Duplicates create independent copies of queries
🔁 References remain linked to the original query and update automatically
They also explored how Power BI behaves as a data receptor, meaning source changes require manual refreshes rather than automatic updates.
☁️ Data Integration & Automation Strategies
The session covered practical approaches to:
📁 Automate weekly and monthly reports using shared folders
🔄 Refresh datasets with minimal manual effort
🏗️ Understand data maturity levels—from Excel-based workflows to data warehousing
Cloud concepts like DirectQuery were introduced as preferred solutions for handling large datasets efficiently.
📈 From Data to Visuals: Scatter Chart Exercise
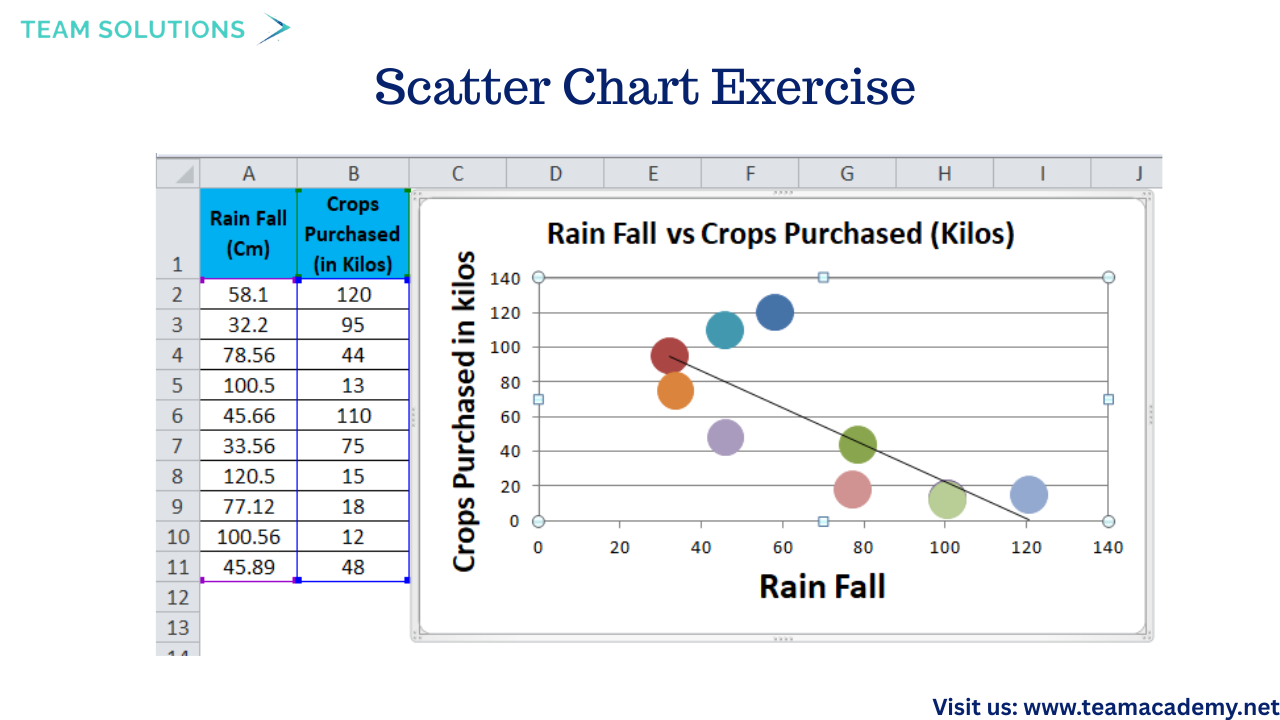
To conclude, participants applied their learning in a hands-on exercise:
📊 Transformed data was visualized using scatter charts
🔄 Data refresh and source updates were tested
🛠️ Common visualization issues were identified and resolved
Despite minor technical challenges during screen sharing, learners successfully connected data preparation with visualization outcomes.
🎯 Key Takeaways
Power Query is the backbone of clean, scalable Power BI reports
Structured data and templates save time and reduce errors
Automation and folder-based reporting enable real-time insights
Visualization becomes easier when data is properly prepared