📊 Power Query Foundations: Transforming Raw Data into Reliable Insights🚀
The Power Query training program officially kicked off with a technical session designed to build a strong foundation in data extraction, transformation, and preparation using Excel and Power BI. The session combined practical demonstrations with a real-world case study to help participants understand how raw data can be transformed into meaningful insights.
🔧 Training Kickoff & Case Study Introduction
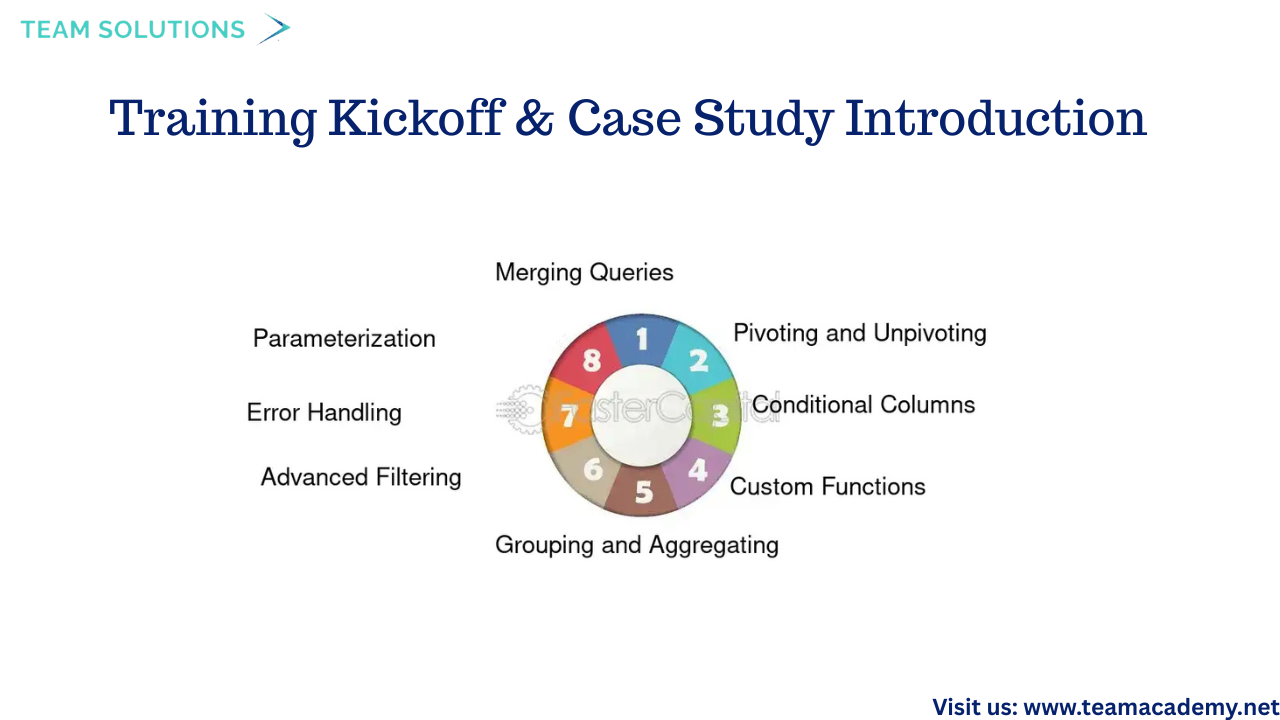
The session began with a technical setup to confirm smooth audio and video connectivity. Participants were introduced to the Northwind Traders Excel folder case study, which will be used consistently throughout the training program to demonstrate Power Query concepts in a structured and practical manner.
Key Power Query concepts introduced included:
🔗 Group By operations
➕ Append queries
🔀 Merge queries
🔄 Pivot & Unpivot techniques
The session was recorded, allowing learners to revisit the content and reinforce their understanding at any time.
📁 Extracting Excel Data the Right Way
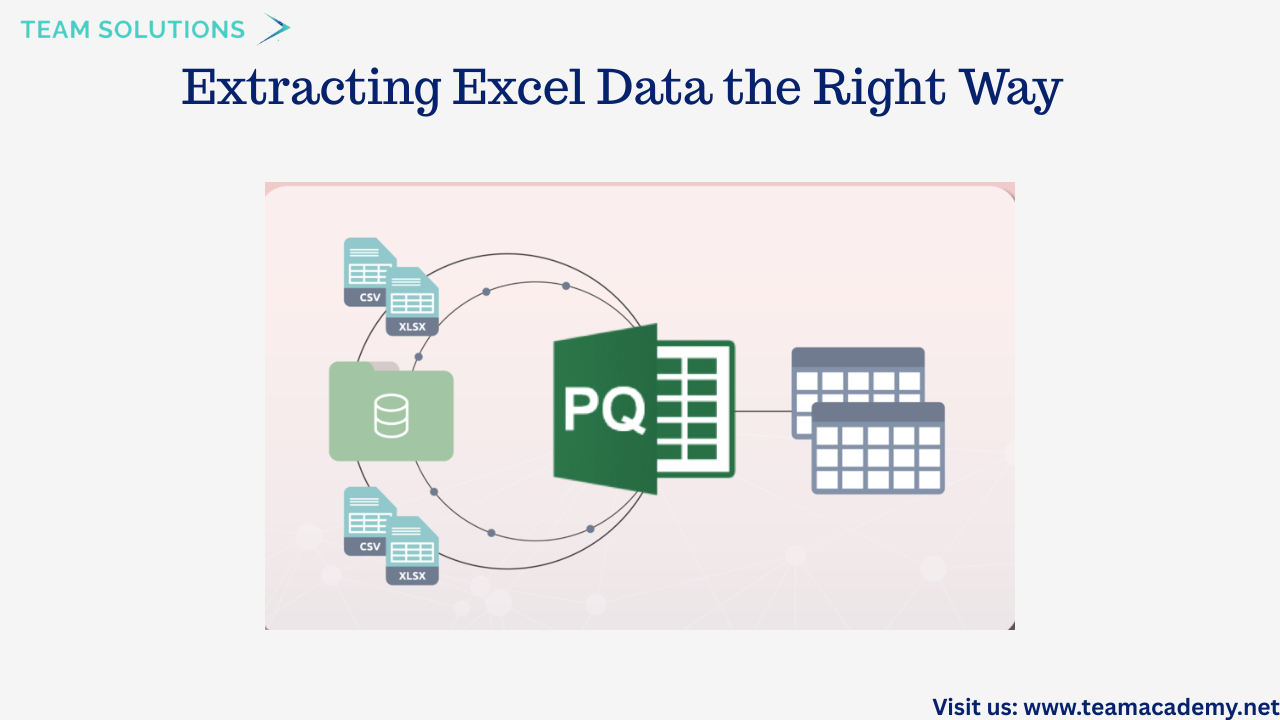
A major focus of the session was on best practices for working with Excel data in Power Query. Participants learned the importance of extracting specific tables instead of entire sheets to avoid unnecessary headers, footers, and manual cleanup.
Topics covered included:
📄 Appending multiple Excel files with identical column structures
➖ Performing simple calculations such as subtraction and grouping
📊 Importing only raw transactional data from folders
🧹 Avoiding summary tables during data extraction
This approach ensures cleaner datasets and more reliable analysis downstream.
📈 Power BI Case Study & Data Sourcing
The Northwind Traders case study was further explored to highlight how Power BI handles data differently from Excel. Participants learned how to:
📂 Import CSV files using Power Query
⚙️ Handle files with varying formats
🔍 Understand why Power BI offers more scalable and dynamic reporting
The session also included a demonstration on splitting text columns, setting the stage for more advanced transformation and modeling exercises.
🛠️ Power Query Transformation Techniques
Participants explored several powerful transformation features in Power Query, including:
✨ Formatting text (uppercase, proper case)
➕ Adding new columns using examples (without complex formulas)
🔢 Performing basic arithmetic calculations
❌ Handling errors and null values effectively
These demonstrations emphasized that Power Query can handle most advanced Excel operations, making it an essential skill for modern data professionals.
🔄 Advanced Excel & Power Query Transformations
The session also covered:
🔁 Transposing data (rows to columns and vice versa)
🧼 Removing special characters from CSV files
🔢 Replacing null values with zeros
📐 Performing statistical calculations such as minimum, mean, and multiplication
Sales-related calculations were demonstrated, including:
💰 Gross Sales = Unit Price × Quantity
📉 Net Sales = Gross Sales × (1 − Discount Rate)
These examples showed how Power Query simplifies complex transformations with repeatable, automated steps.
🧠 Data Modeling Preparation & Schedule Overview
To conclude, participants were briefed on the training schedule:
🗓️ January: Power Query and Data Modeling (with repeat sessions on Fridays)
📊 February: Data Visualization and reporting
Upcoming sessions will dive deeper into data modeling, DAX, and visualization best practices, building on the transformation skills learned in this class. Flexible attendance options were also shared, allowing participants to join either weekday or weekend sessions.
🌟 Final Thoughts
This session laid a strong foundation for working with Power Query and Power BI by emphasizing clean data, efficient transformations, and scalable reporting techniques. With hands-on case studies and real-world examples, participants are now well-prepared to progress into advanced data modeling and visualization topics.
📌 The next session will focus on data modeling and DAX—bringing transformed data to life through meaningful insights.