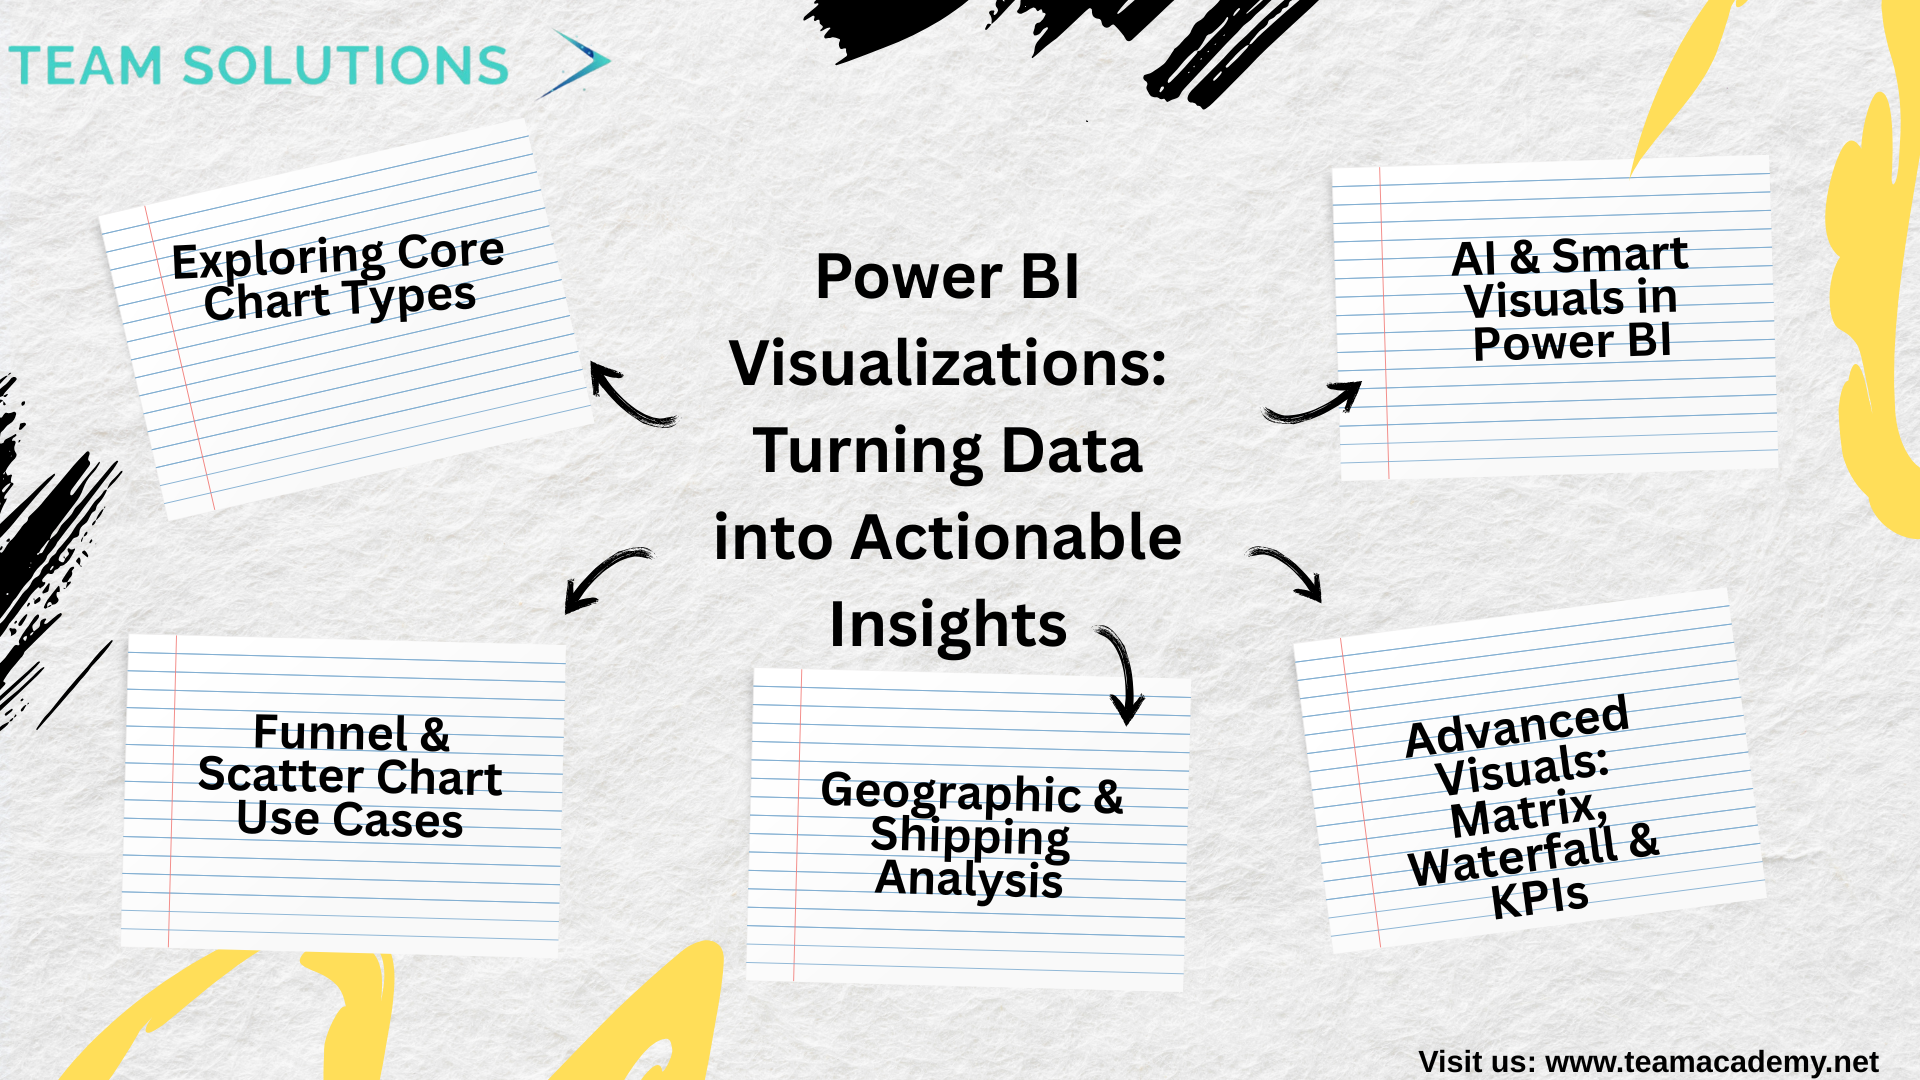
📊 Power BI Visualizations: Turning Data into Actionable Insights
🚀 Introduction
Effective data visualization is the backbone of impactful business intelligence. This session focused on helping learners understand how to transform well-prepared data into meaningful insights using Power BI’s wide range of visualization tools. From basic charts to advanced analytical visuals, the discussion emphasized clarity, accuracy, and business relevance.
📈 Exploring Core Chart Types
Participants explored several commonly used
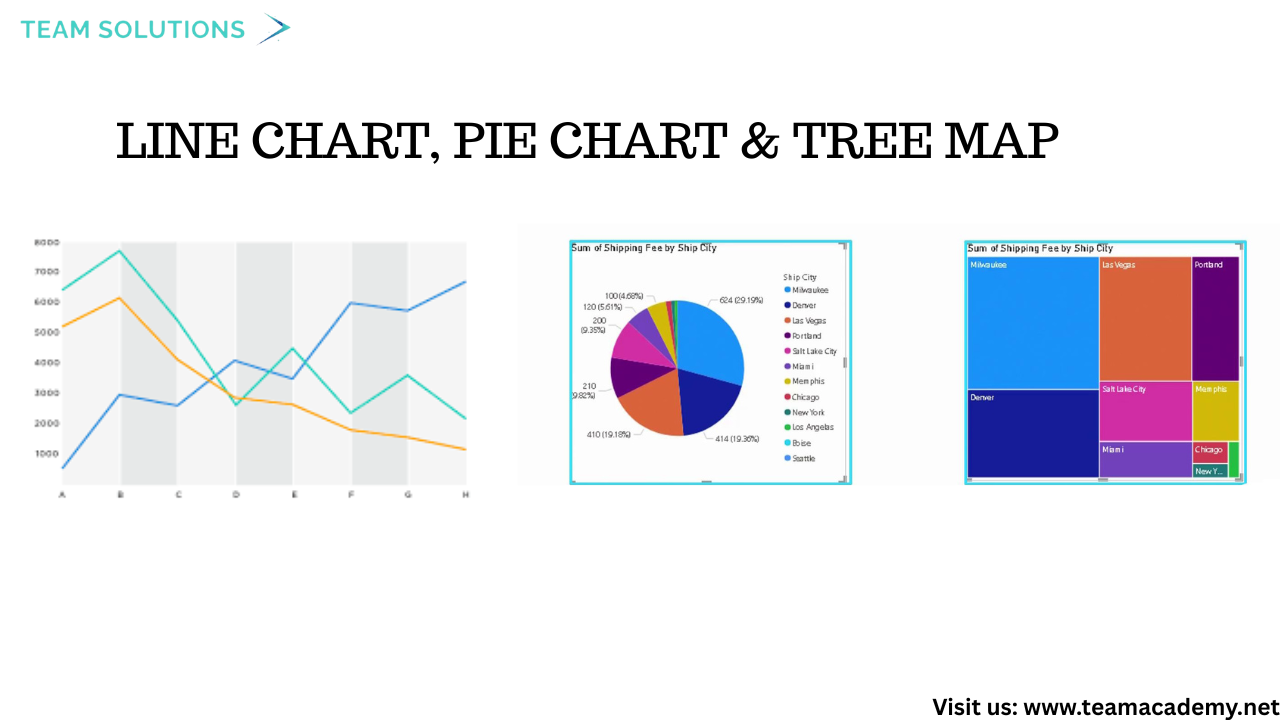
Line Charts for trend analysis over time
Pie & Tree Maps for proportional comparisons
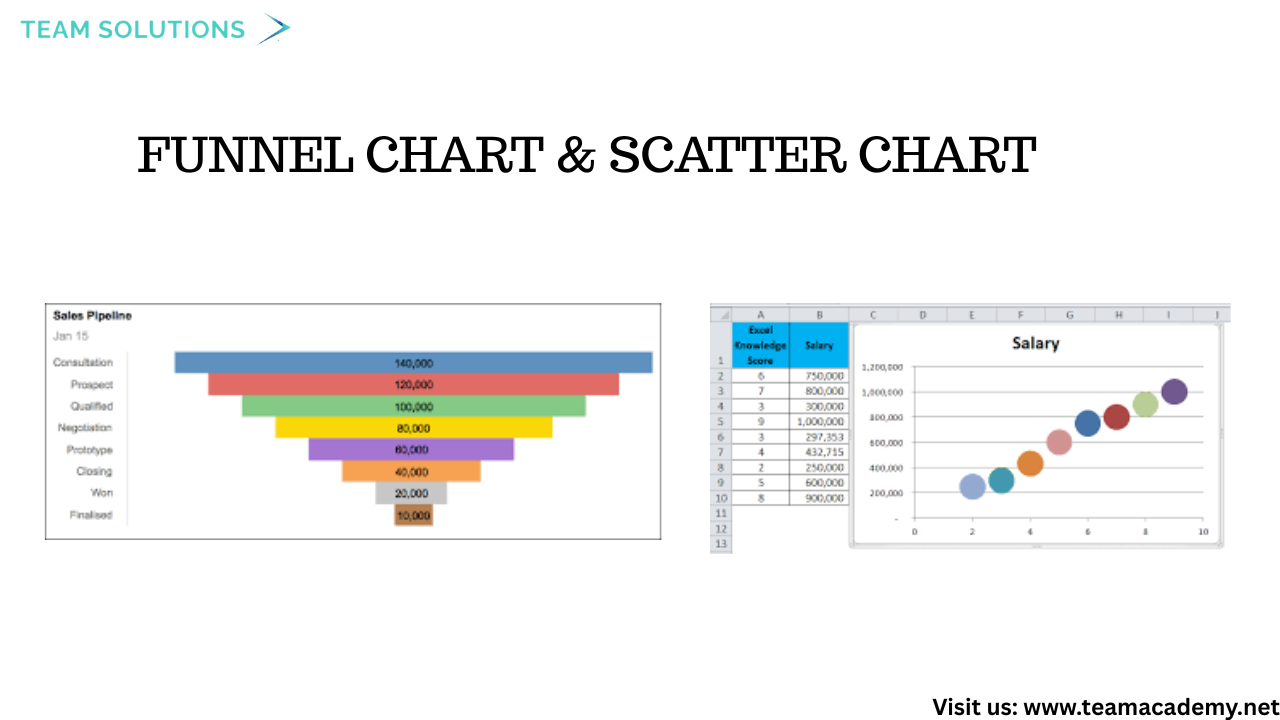
Funnel Charts to analyze sales pipelines and conversion stages
Scatter Charts to compare performance across regions and categories
Special attention was given to data aggregation and formatting, ensuring values were numeric and correctly summarized to avoid misleading visuals.
🧩 Funnel & Scatter Chart Use Cases
Funnel charts were used to analyze sales performance by country, helping identify drop-offs and bottlenecks in the sales process. Scatter charts enabled comparisons between net sales and quantities, making it easier to spot high-performing cities and regions.
Top-N filtering techniques were also demonstrated to focus dashboards on the most impactful data.
🌍 Geographic & Shipping Analysis
Geographical insights were created using maps and scatter visuals, highlighting regional sales performance. The session also covered:
Creating custom columns such as shipping delay and SLA indicators
Handling missing or incorrect data
Visualizing shipping delays using clustered charts and gauge visuals
These techniques help organizations monitor operational efficiency and service performance.
📋 Advanced Visuals: Matrix, Waterfall & KPIs
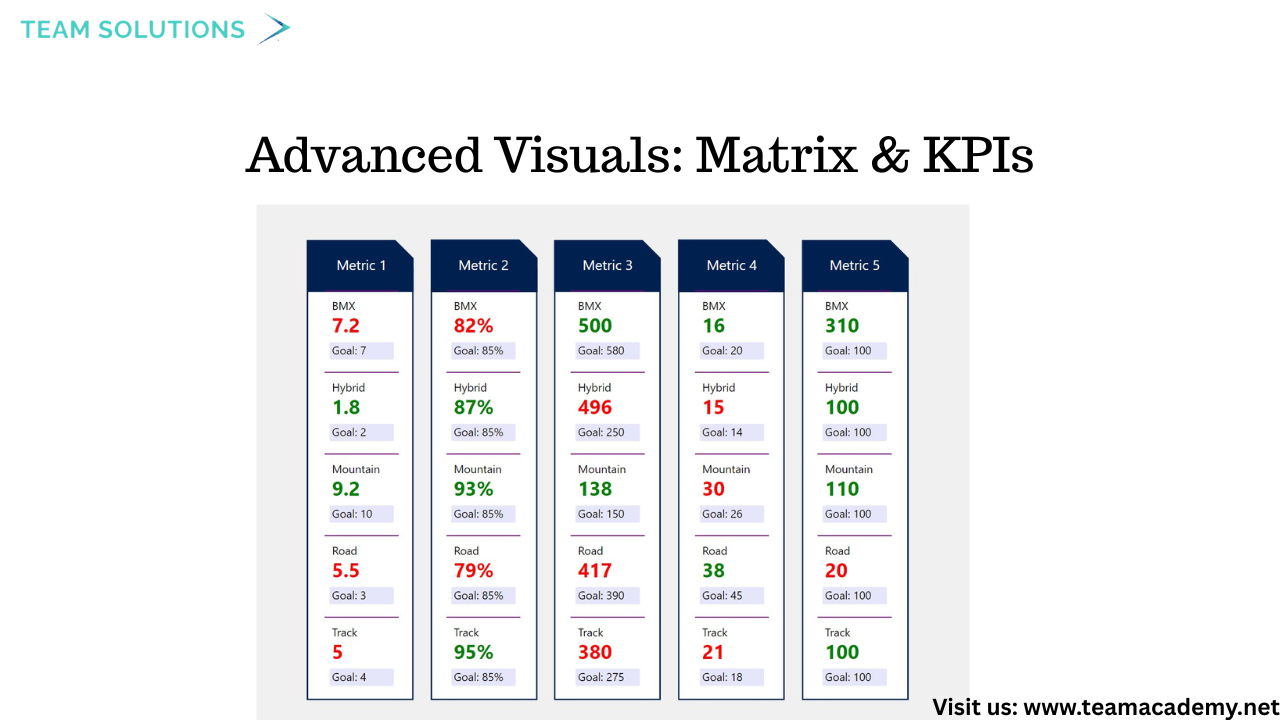
Learners explored advanced visuals to enhance reporting depth:
Matrix visuals for multi-level data breakdowns
Waterfall charts to show positive and negative value changes
Card, KPI, and Gauge visuals to highlight key metrics
Conditional formatting, drill-through functionality, and slicers were introduced to improve interactivity and user experience.
🤖 AI & Smart Visuals in Power BI
The session introduced AI-powered visuals, including:
Q&A Visuals, allowing users to ask questions in natural language
Decomposition Trees, offering hierarchical data analysis
While custom visuals were discussed, the recommendation was to rely on standard Power BI visuals for professional environments due to security and performance considerations.
🔮 What’s Next?
The session concluded with insights into upcoming learning opportunities, including:
Advanced visualization techniques
Microsoft Fabric integration
PowerApps and Power Automate sessions
Certification preparation and mock exam reviews
Participants were encouraged to practice dashboard presentations and apply visualization best practices for real-world scenarios.
🎯 Key Takeaway
Great dashboards aren’t about flashy visuals—they’re about clear storytelling, accurate data, and business-driven insights. Mastering Power BI visualizations empowers professionals to make data-driven decisions with confidence.